Import Prices: Foreign Sellers Reprice After Tariff Ruling
BLS import prices exclude U.S. duties. Since the Supreme Court struck down the emergency tariffs, those pre-duty prices have climbed, eating into importers' relief.
Senior Markets Correspondent
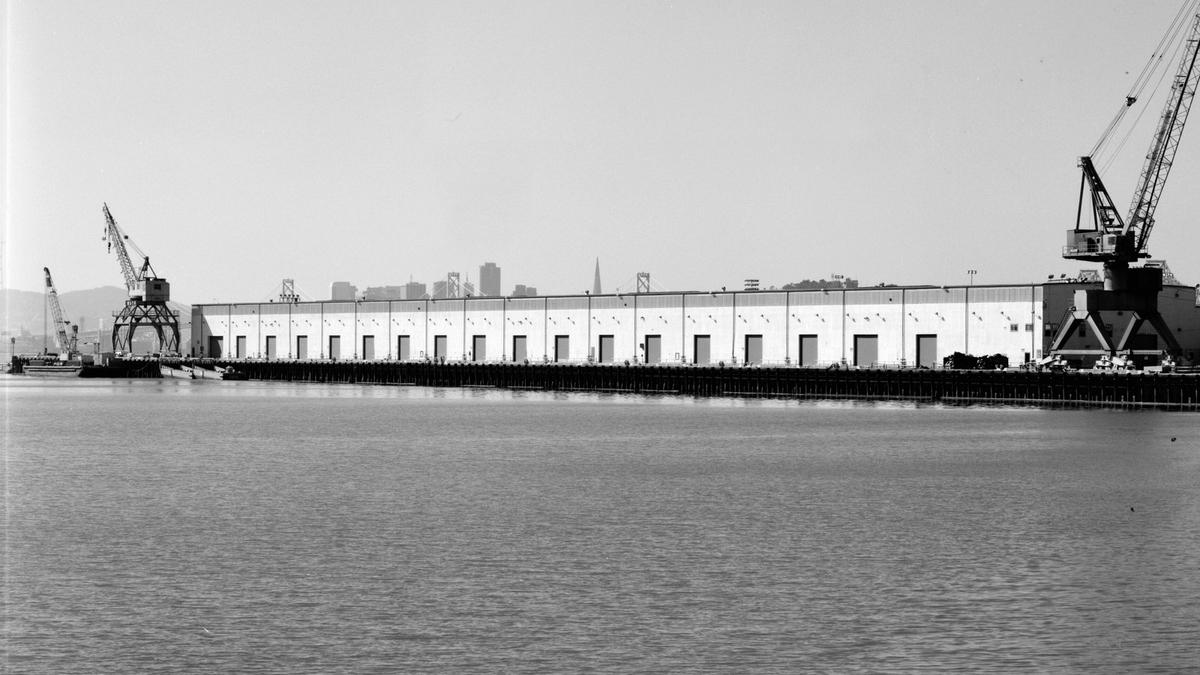
A long cargo transit shed and cranes on the Oakland waterfront across a turning basin. Photo: HAER, Library of Congress, public domain, via Wikimedia Commons
U.S. import prices rose 1.1% in September and 8.1% over the past year, the Bureau of Labor Statistics reported Friday, and the detail matters for anyone who paid the tariffs the Supreme Court struck down in February. BLS measures import prices before U.S. duties are added. Excluding fuel, those prices rose 6.0% over the 12 months to September, compared with 0.3% in the prior 12 months, a period when the emergency tariffs were in force from February 2025 onward. Read together, the figures suggest foreign sellers are recovering some of the cost relief that importers gained when the duties ended.
September Import Prices by the Numbers
The BLS import and export price release showed import prices up 1.1% in September after a 0.5% rise in August. The 8.1% annual increase was the largest since the year ended July 2022. Fuel import prices rose 4.8% for the month and 34.5% over the year, and import natural gas prices were up 96.5% from September 2025.
Nonfuel import prices rose 0.7% in September. BLS said they have not declined on a monthly basis since August 2025, although some October and November 2025 values are missing because of the 2025 lapse in appropriations. The 6.0% annual gain in nonfuel prices was the largest since the 12 months ended April 2022.
The September increase was broad. Prices for imported capital goods rose 0.9% for a second straight month, led by computers, peripherals and semiconductors. Nonfuel industrial supplies and materials rose 1.4% after a 1.3% gain in August. Consumer goods excluding autos rose 0.4%, and automotive vehicles, parts and engines rose 0.3%. Food, feed and beverage import prices were unchanged.
Why Pre-Tariff Import Prices Matter After the Ruling
According to the BLS technical note, import prices are based on the dollar prices paid by U.S. importers, generally either free on board at the foreign port or cost, insurance and freight at the U.S. port. Neither basis includes U.S. customs duties. That makes the index a direct read on what foreign sellers charge before the tariff line is added.
On Feb. 20, 2026, the Supreme Court held in Learning Resources, Inc. v. Trump that the duties imposed under the International Emergency Economic Powers Act were unlawful, as the U.S. Court of International Trade recounted in its Oct. 8 class certification opinion. Duties imposed under other laws were not part of that ruling.
If foreign exporters had absorbed much of the emergency tariffs, pre-duty import prices would have fallen while the duties were in force. They did not. Nonfuel import prices rose 0.3% in the 12 months to September 2025, according to BLS, a pattern consistent with U.S. buyers paying most of the duty. Since the ruling, the pace has changed. The BLS index for nonfuel imports, which is not seasonally adjusted, rose from 132.8 in February 2026, the month of the ruling, to 137.6 in September, a 3.6% increase in seven months by TradeFlock's calculation.
That is a reading of the data, not a finding by BLS, which does not attribute price changes to tariff policy. Other forces are pushing in the same direction, including higher energy costs for overseas manufacturers and strong demand for semiconductors and machinery. But for an importer, the effect is the same: part of the saving from the end of the emergency duties is showing up as higher invoice prices from suppliers.
China, Canada and the Country Detail
Prices of imports from China rose 0.7% in September, the largest monthly increase since December 2021, though they were up only 3.1% over the year. Prices of imports from Canada rose 1.3% in the month, imports from Mexico rose 0.6% and imports from Japan rose 0.6%. Prices of imports from the European Union rose 0.3%.
The smaller annual rise for China, against 6.0% for all nonfuel imports, suggests the repricing is not concentrated in China, which faced some of the steepest emergency tariffs. That comparison is a TradeFlock reading; the country indexes cover manufactured and nonmanufactured goods and differ in mix from the end use categories.
Export Prices and the Terms of Trade
Export prices rose faster than import prices. U.S. export prices climbed 2.2% in September and 11.6% over the year, the largest annual rise since the 12 months ended July 2022. Agricultural export prices rose 2.6%, the most since November 2022, on higher prices for soybeans, corn and wheat.
The U.S. terms of trade index with the European Union, which compares export prices with import prices, rose 3.6% in September. BLS said that was the largest one month increase since it began publishing monthly changes for the index in January 2018. For U.S. exporters, that means each unit sold to Europe bought more imports in September than in August.
What Importers Should Watch Next
The refund process is the other half of the ledger. Customs and Border Protection had refunded about $126 billion in emergency duties plus interest as of Oct. 2, according to the trade court's opinion, and the parties in the class case must jointly propose a schedule for the government's response by today, Thursday, Oct. 22. A TradeFlock check found no proposed schedule on the public docket as of Thursday afternoon in New York, and refunds to the class would follow only after the court adopts one. TradeFlock has covered earlier estimates that the refund bill could reach $182 billion.
Tariff policy has shifted repeatedly, including when the administration halted tariffs on Canada and Mexico and when it imposed its highest rates on Indian imports. Whether higher supplier prices reach shoppers will show up in consumer data. The October import and export price release is scheduled for Tuesday, Nov. 17, at 8:30 a.m. ET, and BLS can revise each month's data for three months after first publication.
Cover photo: Transit shed at the former Oakland Army Base, seen across the turning basin, from the Historic American Engineering Record, Library of Congress, public domain, via Wikimedia Commons (cropped).
Elena Vasquez
Senior Markets Correspondent
Covers Treasuries, the dollar, and the policy signals that reprice risk assets.